library(hddtest)
data(twoNewsGroups)

num_docs <- 200
row_ids <- 1:nrow(twoNewsGroups$sci.med)
group_1 <- sample(row_ids, num_docs)
group_2 <- sample(row_ids[-group_1], num_docs)I’d like to introduce a package that I wrote recently, hddtest, for two sample hypothesis testing of high dimensional discrete data. The package is currently available on GitHub. It contains methods for both multivariate binary data and multinomial data.
I’ll illustrate the use of one of its functions, the multinomial neighborhood test, by using a dataset included in hddtest called twoNewsGroups. It contains document term frequency matrices for two of the 20 newgroups. Each matrix has dimension 594 by 16214. The \((i,j)\) entry of each matrix is the count (term frequency) of the \(j^{th}\) word in the \(i^{th}\) document. The first matrix in the list contains 594 sampled documents from the rec.sport.baseball newsgroup. The second contains 594 sampled documents from the sci.med newsgroup.
We might like to compare two sets of documents to determine whether or not they come from the same newsgroup. To do this, we’ll perform a neighborhood test.
What is a neighborhood test useful for? In testing the equality of parameters from two populations, it frequently happens that the null hypothesis is rejected even though the estimates of effect sizes are close to each other; however, these differences are so small that parameters may not be considered to be different in practice. Another issue is that although the use of p-values is a common measure to draw a conclusion about the population, one may be interested in the measure of indifference or inhomogeneity.
We’ll start by sampling two sets of 200 documents from the sci.med newsgroup. We’ll use this to simulate the null hypothesis being TRUE.
Next for each of the two groups, sum the 200 term frequency vectors together. They will be the two multinomial vectors that we test. We’ll store the result in a list called, vecs2Test.
vecs2Test <- list(NA, 2)
vecs2Test[[1]] <- twoNewsGroups$sci.med[group_1, ] %>%
  colSums() %>%
  matrix(nrow = 1)
vecs2Test[[2]] <- twoNewsGroups$sci.med[group_2, ] %>%
  colSums() %>%
  matrix(nrow = 1)
Now test the null hypothesis that the associated multinomial probability vectors are within some neighborhood, delta, of each other (against the alternative that they are not). We can then use this result to infer whether the sets of documents are likely from the same newsgroup.
vecs2Test %>% multinom.neighborhood.test(delta = 60)
#> $statistic
#> [1] 7.811123
#>
#> $pvalue_delta
#>      [,1]
#> [1,]    1
Here we fail to reject the null hypothesis using a delta of 60. How to choose the appropriate delta? The answer may come from subject matter expertise about the problem domain. Or you can run a simulation to gain insight. Below we define a simulation function.
simulation <- function(data, null_hyp, delta, reps = 30, num_docs = c(200, 200)){

   vecs2Test <- list(matrix(NA, reps, ncol(data[[1]])), matrix(NA, reps, ncol(data[[1]])))

   for(i in 1:reps){
     if(null_hyp){
       # Sample two sets of num_docs from the SAME set of documents
       row_ids <- 1:nrow(data[[2]])
       group_1 <- sample(row_ids, num_docs[1])
       group_2 <- sample(row_ids[-group_1], num_docs[2])
       vecs2Test[[1]][i, ] <- data[[2]][group_1, ] %>% colSums()
       vecs2Test[[2]][i, ] <- data[[2]][group_2, ] %>% colSums()

     }else{
       # Sample num_docs from each of the two DIFFERENT sets of documents
       vecs2Test[[1]][i, ] <- data[[1]][sample(1:nrow(data[[1]]), num_docs[1]), ] %>%
                                      colSums()
       vecs2Test[[2]][i,] <- data[[2]][sample(1:nrow(data[[2]]), num_docs[2]), ] %>%
                                      colSums()
     }
   }

   #Perform the test:
   result <- vecs2Test %>% multinom.neighborhood.test(delta = delta)

} #end simulation function
Now run the simulation for varying values of delta (in the range 1 to 160) testing both the null and alternative hypotheses for 30 replications each. For the null hypothesis simulation, we sample documents from the same newsgroup. For the simulation of the alternative hypotheis, we sample documents from the two different newsgroups. The resulting plot shows one curve for each the 60 simulations (which compute the p-value at each value of delta.)
delta <- 1:160
p.delta.null <- simulation(data = twoNewsGroups, null_hyp = TRUE, delta = delta)$pvalue_delta
p.delta.alt  <- simulation(data = twoNewsGroups, null_hyp = FALSE, delta = delta)$pvalue_delta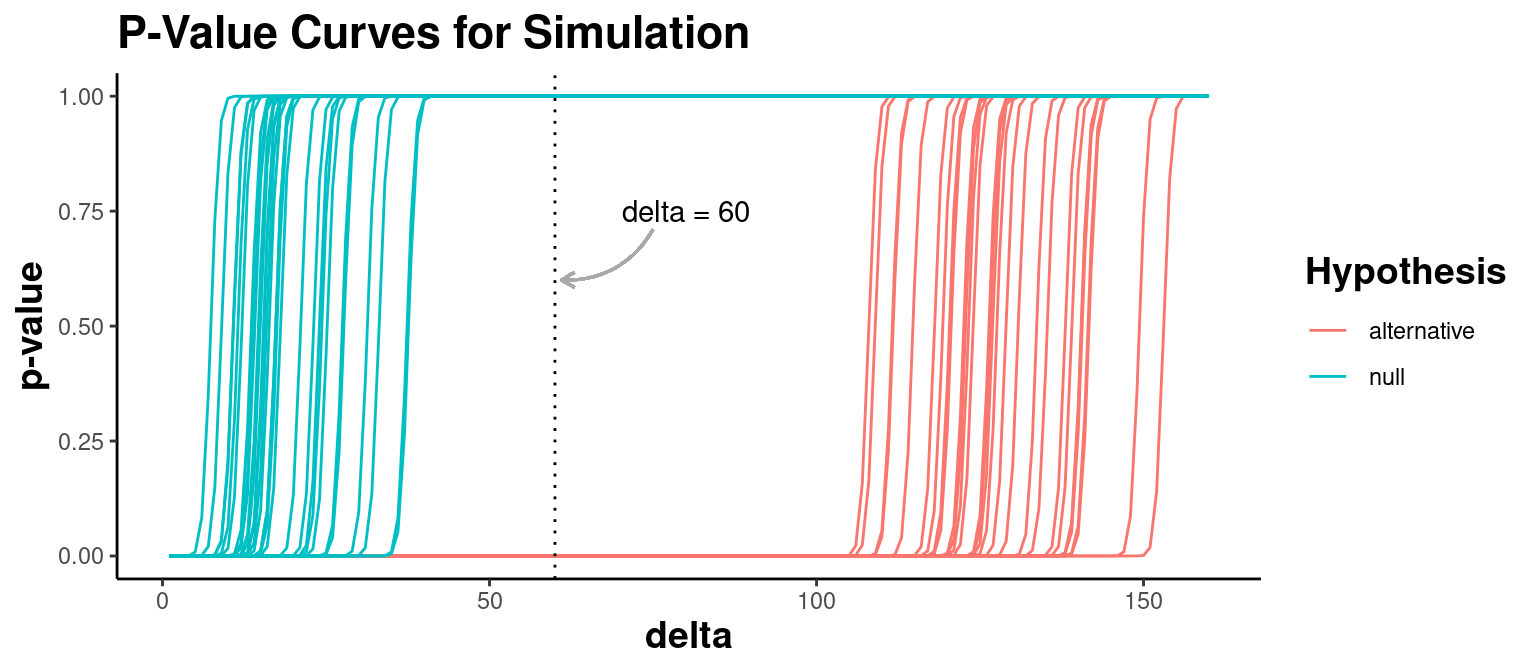
Notice in the plot above that for delta in the range of about 40 to 100, the p-value is large when the the two sets of documents come from the same newsgroup (shown in blue) and small when the two sets of documents come from different newsgroups (shown in red). So, our previous choice of delta=60 seems reasonable for making the correct conclusion.
The methods for this package were developed in collaboration with my UMBC PhD thesis advisor, Dr Junyong Park, and published in 1 and 2. Full details about the statistics used and their distributions are documented in these papers. To see the full list of functions available in hddtest, see the GitHub README. Thanks for reading!